A1 for Data Science
Due date: Mar 19 (23:55)
This is an introductory assignment designed to get you up and running with HTML, CSS, JavaScript, and designing a visualization with D3. Be aware that this course uses version 6 of D3.
Use the usa_nominal_gdp_top10_2021.csv dataset for this assignment.
Learning objectives
- Understand how HTML, CSS, and JS work together
- Loading data into d3 from csv
- Properly laying out the svg element in html (aka skeleton html file)
- Creating a bar chart visualization
Recommended procedure

- Ensure that you can load the data properly into d3
- You should create a bar chart with one bar per state. The bar height represents the nominal GDP (millions of U.S. dollars) of each state.
- Label x and y axes: 1) "States" underneath the x-axis, 2) "Nominal GDP (millions of $)" on the left side of the y-axis
- Label the data points and the scale on x and y axes: 1) name of the state for each bar on the x-axis, 2) scale in numbers on the y-axis (select the intervals and formatting that you find useful / informative)
Grading
We’ve broken the learning objectives down by numerical grade, 1 through 5. You will receive the best grade for which you’ve met at least one objective plus all fully completed grades below. Please be aware that that means that if you haven’t fully met all objectives for getting a 3 then you won't get a 2 or 1 even if you’ve completed all the objectives for the grade 2 or 1. We’ve structured the objectives so that they build on each other for the most part. So, in order to show that you’ve learned something for grade 2 then you’ll need to show that you’ve also met all requirements for grade 3, grade 4 and then some.
Grade 4 (50% - 62%)
- 15%: Submitting according to the procedure
- 25%: Properly setting up an html page with d3 (v6), js and css included
- 22%: Properly laying out the svg element in html (aka skeleton html file)
Grade 3 (62.5% - 74.5%)
all the above plus:
- 5%: Loading data into d3 from csv
- 7.5%: Creating svg shapes (bars) based on data
Grade 2 (75% - 87%)
all the above plus:
- 7.5%: Showing x and y axes for bar chart
- 5%: Add labels to x and y axes (as children elements to the SVG using d3): 1) "States" underneath the x-axis, 2) "Nominal GDP (millions of $)" on the left side of the y-axis
Grade 1 (87.5% - 100%)
all the above plus:
- 10%: Label the data points and the scale on x and y axes (as children elements to the SVG using d3): 1) name of the state for each bar on the x-axis, 2) scale in numbers on the y-axis (select the intervals and formatting that you find useful / informative)
- 3%: Add a title (an HTML "h1" element on top) summarizing the visualization
Submission instructions
Submissions should be done BOTH on Moodle and on the Uni Wien Almighty servers (see the instructions below), e.g.: http://wwwlab.cs.univie.ac.at/~myusername/VIS23S/A1/ (replace 'myusername' with your u:account username, which you use to login to Uni Wien services such as u:space)
Make sure your submission (i.e. the code) on the almighty web instance and on Moodle are identical. If you make any changes to your web instance submission after the deadline, make sure you submit the same changes to Moodle as well. These submissions will be compared by us and the modification dates of the files on the web servers will be checked in accordance with the deadlines & grace day usage.
Using your Almighty Web Instance
Login to your student web server instance with the following credentials using a FTP/SFTP client:
- Server: almighty.cs.univie.ac.at
- Username: myusername (your u:account username)
- Password: your student password
Under the user directory (/home/myusername) in the server, create a folder called "public_html" (if it doesn't exist already). The files in this directory are made automatically online under http://wwwlab.cs.univie.ac.at/~myusername/ (replace 'myusername' with your u:account username, which you use to login to Uni Wien services such as u:space)
Inside the public_html folder create a folder called "VIS23S". Inside VIS23S create a folder called "A1". Your submission files should be placed directly in this order, that means your index.html should be immediately inside the A1 folder for this particular submission.
Make sure you visit the site http://wwwlab.cs.univie.ac.at/~{u:account username}/VIS23S/A1/ on your browser (we'll test with Chrome / Firefox) and that your code runs as expected.
Moodle Submission
Please submit a folder containing an index.html file which will open the view, the data file, and a readme describing what you did, why, and the data source(s) you used, as well as any other associated files to moodle. Please be sure if you submit a zip or tar.gz file that it properly unzips the files into a directory. It’s a good idea to try unzipping your file before submitting it to ensure that everything unzips properly and you don’t lose points. Use the following naming scheme for your submission: “myusername_A1.zip” - replace myusername with your u:account username. When we grade your work we will run
python -m SimpleHTTPServer
in the directory and then open index.html. So please ensure that your visualization works correctly under those conditions. Also, please make sure that you include your name in the readme file.
Just to be clear, here is a sample directory layout. You do not have to use this exact format but it must be clear which file is your readme, your html page, your data file, and your javascript file.
myusername
      \
      | README.md
      | index.html
      | d3.min.js
      | vis.js
      | style.css
      | data.csv
Any additional libraries without prior permission will result in a 0
A1 for Visualization of humanities data
Visualization basics with Tableau
Due date: Mar 19 (23:55)
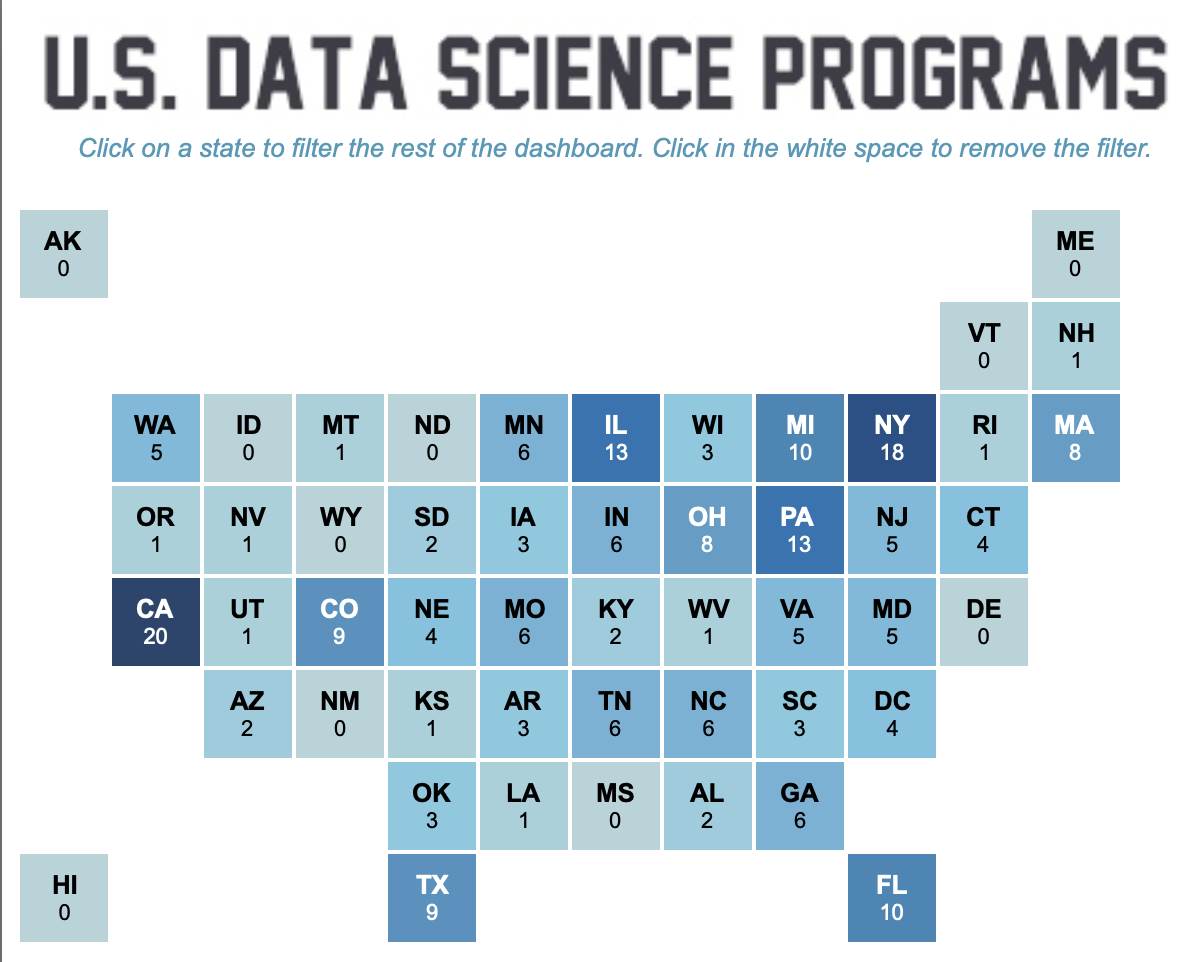
The purpose of this assignment is to learn how to create visualizations using ready-made tools. One of the tools for this class will be the Tableau software package. Tableau automates the creation of visualizations and uses many of the proper visual encoding techniques that we will discuss during the course by default.Here are a few examples from Tableau Public (Click on the image to open the Tableau Public site):


Getting started:
1. Install Tableau
- Download and install Tableau for Students
- Download and install Drivers
- Create a tableau public account
Tableau content that is published to Tableau Public on the web can be viewed in your web browser regardless of your operating system. However, to author and publish views and workbooks, you use Tableau Desktop Public and Professional Editions. Tableau's data visualization software is provided through the Tableau for Teaching program.
2. Please read
- VIS Tableau Tutorial
- Preparing Excel files for analysis
- If there are problems with Excel imports, export the Excel file as a csv file and import this file as a text file.
- Quick start guide: How to connect to data?
- Tutorial Data: download CSV
- Tutorial Dashboard
- Best Practices for Effective Dashboards
3. Connect to data
To make sure you are all set for the tutorial try to connect to an excel sheet (e.g. the assignment dataset, see link below).
- It works? → Perfect
- It didn’t? → Try to fix it – maybe a driver is missing (see link above) or convert excel to csv
There is also a Moodle Forum if you want to share insights with your fellow students or if you encounter problems.
Assignment
The first part of your assignment is to develop a single interactive Tableau dashboard with several views (at least 3), that would allow manipulation and exploration of the dataset on the Charles W. Cushman collection of photographs in various ways. A view is a single graphical representation of the data (i.e. a chart) and a dashboard connects multiple views in a meaningful way. Any dashboards after the first will not be counted towards your grade. Your solution should also provide a coherent overview of your personal findings.
The second part of your assignment includes a short write-up (2-3 pages) that describes the reasoning process that led to your dashboard. This write-up should discuss alternative ideas you had, insights you gained from the data, and why you went with your final design choices. Try to incorporate the things you learned from the design principles class. This write-up will be a major part of the grade for this assignment so try to clearly explain your ideas. Please also include screenshots or sketches where necessary to make your point. You can also include a short reflection on your experiences with Tableau itself. For example, any difficulties you had with making exactly the view you wanted or the ease of prototyping.
Dataset: Charles W. Cushman Photography Collection
The dataset (csv file) contains a selection of metadata from the photographs of Charles W. Cushman (1896-1972), an American amateur photographer whose full collection is hosted at Indiana University.
Submission
You will have to sign up for a free Tableau Public account and when you are finished with your dashboard in Tableau Desktop, publish it to the web by following: Server -> Tableau Public -> Save to Tableau Public...
Please also submit your assignment as a zip file containing both your Tableau dashboard and a short write-up essay (as pdf) to Moodle. For this, you will have to save your visualization as a "Packaged Workbook" (File -> Export Packaged Workbook). This will save the data with the workbook so that both visualizations and data are packed up in one file. Failure to do this will result in a point penalty. The write-up should include a link to your Tableau Public dashboard. There is a share Button for each dashboard, use this link.
Please note: If you submit to only one of two places (Tableau public or Moodle) the assignment will not be counted as submitted! The report (including the link to the Tableau Public Dashboard) and worksheet should be uploaded to Moodle by the submission deadline. Use the following naming scheme for your submission: "matrikelnumber_A1.zip". Late Submissions are possible, see bottom of this page.
Grading
We will evaluate your Tableau visualization based on the quality of communicating fundamental aspects of the given dataset. Does it give the viewer a good understanding of selected characteristics of the data and exploratory insights? Here, we are looking for both effectiveness and creativity. We do realize that you might have very little or no VIS-background. Therefore, we are looking for good effort, not necessarily some conference paper-worthy new idea. The purpose of this assignment is to provide you with experience in the analysis of data like this and the creation of visualizations to present the data.
We will grade your submission and presentation with the following scheme:
- 25 % producing an interesting solution / creativity
- 25 % proper use of visual encodings / interactions
- 10 % implementation / realization
- 40 % explanations / reasoning why this is a good visualization
The report and worksheet should be uploaded to Moodle by the submission deadline.
Late submission
Late Submissions are possible, you have a total of five grace days for all assignments. After these days are used up, remaining assignments must be submitted on time.